AI Analytics Guide for Small Business Success
Marketing, AI marketing analytics small business
Marketing Data Without Strategy Is Noise: A Small Business AI Analytics Guide
If your team is drowning in dashboards but still arguing about what’s actually working, you are not alone. This guide shows small business owners, CEOs, and marketing managers how to turn scattered numbers into clear, AI‑powered decisions that grow revenue—not just reports.

Why Most Small Business Analytics Setups Are Broken
Across the world, small businesses are buying tools, installing pixels, and setting up dashboards. Around 70–77% already use AI or analytics tools in some form. Yet many still make decisions based on gut feel, not data-driven decision making. The problem is not a lack of data. It is a lack of strategy. Here are three common symptoms.
1. Tracking Everything, Understanding Nothing
You have Google Analytics, Facebook Ads Manager, maybe a marketing dashboard setup from an agency. Every week you see:
- Page views, sessions, bounce rate, engagement rate
- Likes, impressions, followers, email opens
- A dozen different “conversions” you are not sure you defined correctly
The result: meetings full of numbers, but no clear story. This is what “marketing data without strategy” looks like—lots of noise, no signal.
2. Data Not Connected to Revenue
The only numbers that really keep the lights on are revenue, margin, and cash. Yet most marketing reports stop at clicks and form fills. When data is not tied to revenue, you cannot answer basic questions like:
- Which channel brings leads that actually become paying customers?
- How much does it really cost to win a new customer?
- Which campaigns should we double down on, and which should we cut?
Without linking marketing data to your CRM and sales numbers, you are guessing, not doing serious marketing ROI tracking.
3. Reporting Without Action
Many teams invest time in monthly decks and dashboards, but nothing changes after the meeting. No budgets are shifted, no campaigns are paused, no new tests are launched. In other words, reporting is treated as a task to complete, not a tool to drive action.
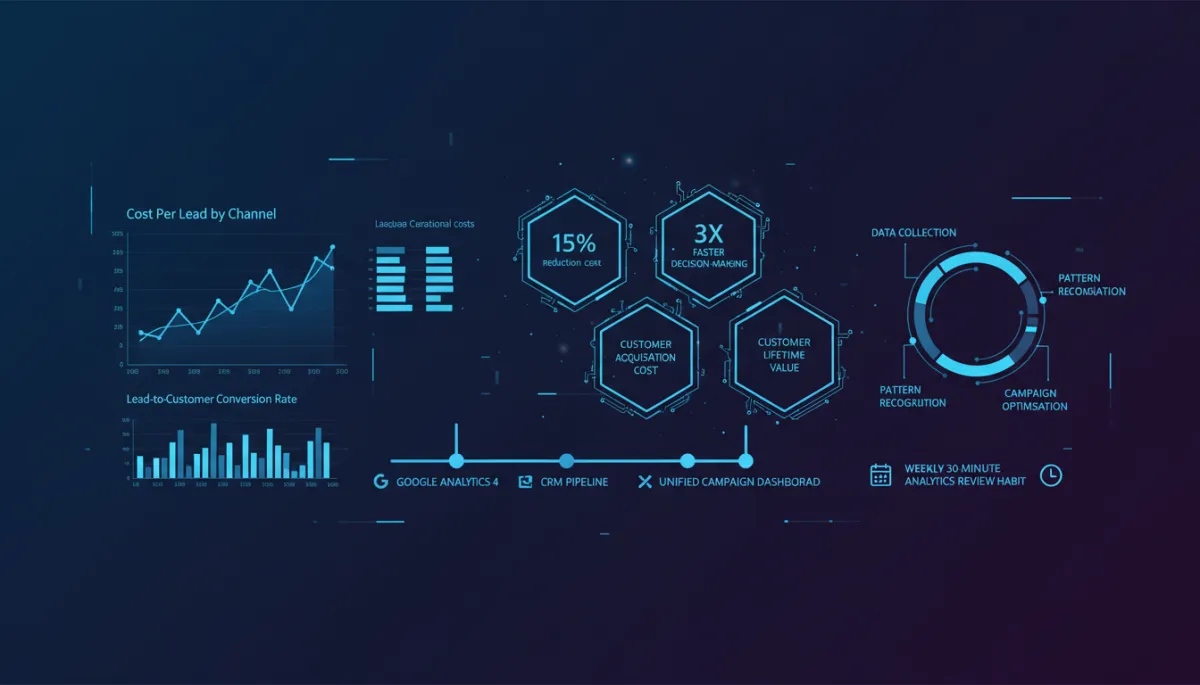
This is a huge missed opportunity. PwC found that companies using AI analytics make decisions up to 3x faster and cut operational costs by around 15%. The speed and savings come from one thing: using data to change what you do, not just what you report.
The 4 Metrics That Actually Matter
For AI marketing analytics for small business to be useful, you do not need 40 metrics. You need four, tracked consistently and broken down by channel and campaign. These four connect your marketing directly to money.
1. Cost Per Lead (CPL) by Channel
Question it answers: How much do we spend to get one new lead from each source?
Formula (per channel): Ad spend ÷ number of leads. If you spend $1,000 on Google Ads and get 40 leads, your CPL is $25. If Instagram costs $60 per lead, you know where to push budget first—assuming lead quality is similar.
2. Lead-to-Customer Conversion Rate
Question it answers: What percentage of leads turn into paying customers?
Formula: Customers ÷ leads × 100. If you had 100 leads from your website last month and 15 became customers, your lead-to-customer rate is 15%. Tracking this by channel shows which sources produce serious buyers, not just “free ebook” downloaders.
3. Customer Acquisition Cost (CAC)
Question it answers: How much does it cost us, all-in, to win one new customer?
Formula: Total marketing and sales costs ÷ number of new customers. Include ad spend, software, and a fair share of salaries. If it costs you $400 to win a customer who only spends $300, you do not have a marketing problem—you have a business model problem to fix.
4. Customer Lifetime Value (CLV or LTV)
Question it answers: How much revenue does the average customer bring over the whole relationship?
A simple way to estimate: Average order value × average number of purchases per customer. If your average customer buys 4 times at $150 each, your LTV is $600. Now you know how much you can safely spend on CAC and still be profitable.
How AI Transforms Each Analytics Layer
AI marketing analytics small business tools are no longer just for big enterprises. Over half of small businesses already use some form of AI, and most report higher productivity and revenue. The real power comes when AI supports each layer of your analytics: collection, insight, optimisation, and prediction.
1. Smarter Data Collection
Modern tools like Google Analytics 4 (GA4) now use machine learning to fill gaps where tracking is blocked by cookies or consent. GA4’s generated insights and AI Assistant traffic channel also highlight which sources— including AI chatbots like ChatGPT and Gemini—are sending visitors. This means your data is more complete and less biased than old-school tracking.
2. Pattern Recognition You Would Never Spot Manually
AI is very good at scanning huge amounts of data and spotting patterns:
- Which headlines tend to bring higher-value customers
- Which email sequences lead to more repeat purchases
- Which combination of channel + offer + timing yields the best LTV
Instead of you or your team digging through spreadsheets, AI surfaces the patterns that matter so you can respond quickly.
3. Campaign Optimisation in Real Time
AI does not just analyse; it can also act. Agentic AI systems now adjust bids, pause weak ads, and test new audiences automatically. For a small team, this is like having a 24/7 junior analyst and media buyer in one. Studies show AI-driven optimisation can cut customer acquisition costs by 20–30% when combined with human oversight.
4. Predictive Insights You Can Plan Around
Predictive analytics uses past behaviour to forecast future results—such as which leads are most likely to buy, or which customers are at risk of churning. GA4’s cross-channel budgeting and generated insights already point in this direction: they help you model “what if” scenarios before you spend. This turns your marketing dashboard setup from a rear-view mirror into a forward-looking GPS.
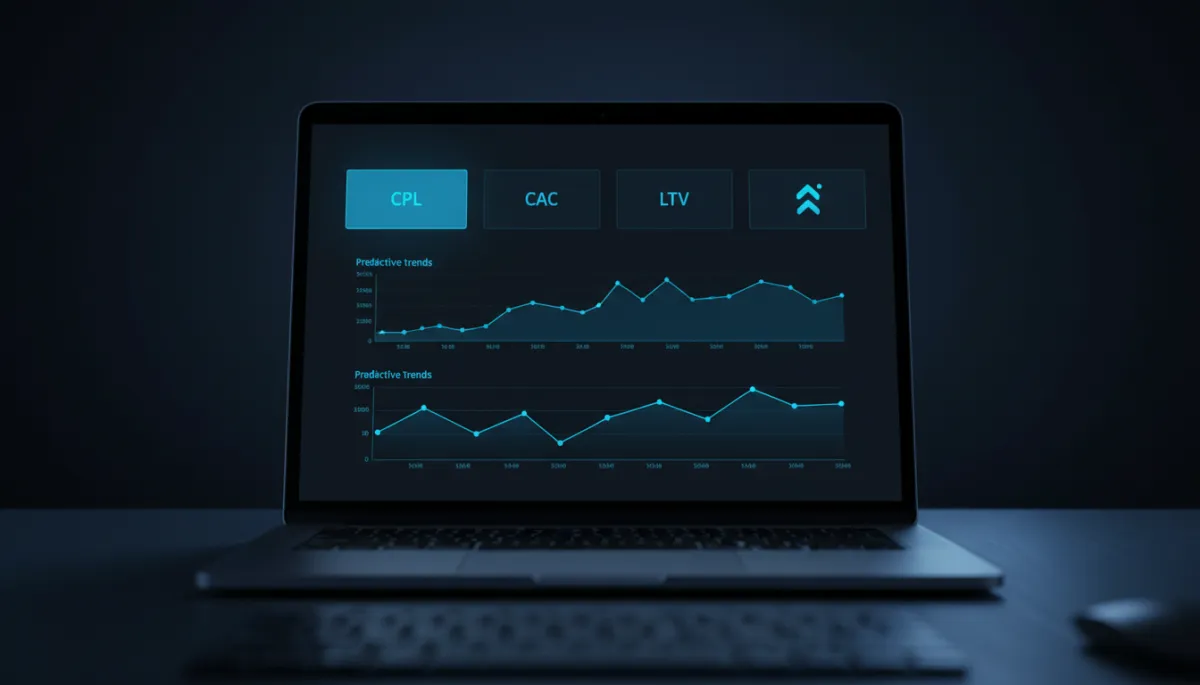
Clear CPL, CAC and LTV views help small teams shift budget with confidence.
Building Your Analytics Stack: 3 Core Layers
You do not need an enterprise data warehouse to get started. A practical, AI-ready stack for small business can be built with three layers that talk to each other.
Layer 1: Google Analytics 4 for Behaviour and Traffic
GA4 is your foundation. It shows where visitors come from and what they do on your site. With the latest updates, you can:
- Track AI Assistant traffic from tools like ChatGPT and Gemini as a distinct channel
- Connect Google Business Profile to see local actions such as calls and direction requests
- Use generated insights to highlight sudden changes or opportunities
Configure GA4 to track real leads (form submits, bookings, demo requests), not just page views. This is the base for reliable CPL by channel.
Layer 2: CRM Pipeline Tracking for Revenue
Your CRM—HubSpot, Pipedrive, Zoho, Salesforce, or similar—is where leads turn into deals and revenue. To make analytics meaningful:
- Capture lead source and campaign for every contact
- Track pipeline stages consistently (new lead, qualified, proposal, won, lost)
- Log revenue against the contact or deal when it closes
This allows you to calculate lead-to-customer rate and LTV by channel. It also gives AI tools the first-party data they need to find patterns unique to your business.
Layer 3: Unified Campaign Dashboard for Decisions
Finally, bring GA4 and CRM data into a single unified campaign dashboard. This can be in Looker Studio, Power BI, or a dedicated AI marketing analytics platform. The key is that it shows:
- CPL, lead-to-customer rate, CAC, and LTV side by side for each channel
- Trends over time, not just one-off snapshots
- Simple AI-driven alerts when a metric suddenly improves or drops
This is where data turns into daily decisions: increase spend here, fix conversion there, pause that underperforming campaign. It is the heart of data-driven decision making.
The Weekly 30‑Minute Analytics Review Habit
Tools and dashboards are not enough. You need a simple rhythm that forces action. Here is a 30‑minute weekly habit that busy founders and marketing managers can actually keep.
Monday: 10‑Minute CPL Review
Start the week by opening your dashboard and checking Cost Per Lead by channel for the last 7 days. Ask:
- Which channel has the lowest CPL?
- Has any channel’s CPL spiked or dropped sharply?
- Do we need to shift 10–20% of budget based on this?
Make one small change every Monday—raise, lower, or pause. Let AI bidding systems and algorithms do the heavy lifting from there.
Wednesday: 10‑Minute Pipeline Review
Midweek, switch to your CRM pipeline. Look at:
- Lead-to-customer conversion rate by channel for the last 30–60 days
- Stages where leads are getting stuck or dropping off
- Any patterns AI flags—such as slower follow-up on certain lead sources
Decide one sales or follow-up improvement: faster response, better qualification questions, or a new email sequence for a specific segment.
Friday: 10‑Minute Campaign Review
Finish the week by looking at campaign-level performance:
- Which campaigns are delivering the best CAC and LTV?
- What creative, offers, or audiences are winning?
- Where can AI help test a new variation next week?
Capture one clear test to run next week. Over a quarter, these small, consistent changes compound into big gains in marketing ROI tracking.
Turn Noise into Strategy with a Free Audit
AI is no longer a nice-to-have. Around 77% of small businesses now use AI regularly, and those that do report higher productivity, stronger revenue, and better decision-making. The question is not whether you have data—it is whether your data is arranged in a way that AI can use to drive clear, profitable action.
If your current reports feel like noise, it is time to simplify: four core metrics, three core tools, one weekly habit. From there, AI marketing analytics for small business can finally do what it promises—cut waste, focus spend, and help you grow with confidence.
Want a clear, outside view of where your analytics and website are helping or holding you back? Get a Free SEO and Website Audit at nexurate.com. You will see exactly what to fix, what to keep, and how to build an analytics setup that finally works for your business—not against it.
